NotWise
Desert Rat
- Joined
- Sep 7, 2015
- Posts
- 14,455
I've always wished there was some way to know how readers get to our stories. Did they get it from the New list? From the category hub? From a search? etc, etc. That will probably never be possible, but I got some insight from my most recent story, which was new in Romance on Tuesday.
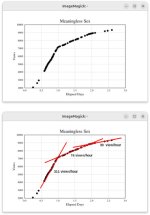
The top graph below shows views over time. The graph can be described in three straight line segments, shown in the lower graph. The break between the lines come at changes in how the story is shown to readers.

At first, the story was readily visible on the New list and the Category hub, and got 311 views/hour. That dropped to 74 views/hour after the first day, The story was deep in the New list where it probably got few views, but it was still among the first 10 stories on the category hub. A simple explanation is that the New list delivered 237 views/hour on the first day and the category hub delivered 74 views hour. That's 76% from the New list. Then the New list views disappeared on the second day.
The story got 30 views/hour on the third day when it was "below the fold" on the category hub. Again, simple explanation is that the story got 30 views/hour from people who were willing to look below the fold. There was a loss of 44 views/hour, or 59%, of readers who wouldn't look beyond the first ten stories on the category hub.
This pattern would be different in a busy hub like I/T. It's probably common to other low-traffic hubs like Romance, but the exact numbers are going to vary from story to story.
The top graph below shows views over time. The graph can be described in three straight line segments, shown in the lower graph. The break between the lines come at changes in how the story is shown to readers.

At first, the story was readily visible on the New list and the Category hub, and got 311 views/hour. That dropped to 74 views/hour after the first day, The story was deep in the New list where it probably got few views, but it was still among the first 10 stories on the category hub. A simple explanation is that the New list delivered 237 views/hour on the first day and the category hub delivered 74 views hour. That's 76% from the New list. Then the New list views disappeared on the second day.
The story got 30 views/hour on the third day when it was "below the fold" on the category hub. Again, simple explanation is that the story got 30 views/hour from people who were willing to look below the fold. There was a loss of 44 views/hour, or 59%, of readers who wouldn't look beyond the first ten stories on the category hub.
This pattern would be different in a busy hub like I/T. It's probably common to other low-traffic hubs like Romance, but the exact numbers are going to vary from story to story.
Last edited: